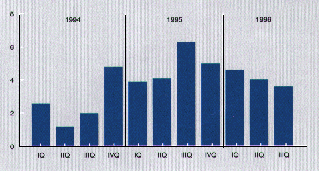
Moldova
Main trading partners of the Republic of Moldova
| Export | Import | ||||||
| (US$ million) | 1995 | 1996 pref | Change | 1996 | 1996 pref | Change | |
| CIS Countries | 466.9 | 548.3 | 81.4 | 568.9 | 653.3 | 84.4 | |
| Russia | 360.1 | 431.5 | 71.4 | 278.0 | 289.4 | 11.4 | |
| Ukraine | 58.9 | 48.3 | -10.6 | 228.5 | 290.9 | 62.4 | |
| Belarus | 26.6 | 34.3 | 7.8 | 50.7 | 61.2 | 10.5 | |
| Other countries | 21.4 | 34.2 | 12.8 | 11.7 | 11.8 | 0.1 | |
| Central & Eastern European countries | 278.6 | 255.9 | -22.7 | 120.4 | 179.1 | 58.7 | |
| Romania | 168.7 | 133.2 | -25.5 | 56.0 | 72.4 | 16.4 | |
| Bulgaria | 103.7 | 76.1 | -28.6 | 31.9 | 57.2 | 25.3 | |
| Hungary | 21.4 | 12.9 | -8.5 | 8.6 | 14.2 | 5.7 | |
| Other countries | 6.7 | 2.7 | -3.0 | 24.0 | 36.3 | 11.3 | |
| European Union countries | 86.2 | 78.4 | -7.8 | 115.2 | 164.8 | 49.6 | |
| Germany | 45.4 | 30.0 | -15.4 | 46.6 | 67.9 | 22.3 | |
| Italy | 15.6 | 21.1 | 5.5 | 19.3 | 33.7 | 14.4 | |
| The Netherlands | 2.3 | 8.7 | 6.4 | 6.6 | 10.5 | 3.9 | |
| Other European Union countries | 22.9 | 18.6 | -4.3 | 43.7 | 52.7 | 9.0 | |
| Other countries | 33.7 | 44.3 | 10.6 | 36.2 | 74.5 | 38.3 | |
| TOTAL | 745.5 | 804.2 | 840.7 | 1071.7 |
Main macroeconomic indicators
| Gross Domestic Product | Aggregate social product | Net material product |
| 1990=100 | Annual percentage change | 1990=100 | Annual percentage change | 1990=100 | Annual percentage change |
| 1990 | 100.0 | -2.4 | 100.0 | 2.9 | 100.0 | -1.5 | |||
| 1991 | 82.5 | -17.5 | 85.7 | -14.3 | 82.0 | -18.0 | |||
| 1992 | 58.6 | -29.0 | 65.2 | -24.0 | 58.4 | -28.7 | |||
| 1993 | 57.9 | -1.2 | 63.1 | -3.1 | 56.9 | -2.6 | |||
| 1994 | 39.8 | -31.2 | 44.2 | -30.0 | 39.7 | -30.4 | |||
| 1995 | 38.6 | -3.0 | 42.4 | -4.0 | 38.1 | -4.0 |
| Industrial Production | Agricultural production | Average monthly inflation rate |
| 1990=100 | Annual percentage change | 1990=100 | Annual percentage change |
| 1990 | 100.0 | 3.2 | 100.0 | -12.9 | |
| 1991 | 88.9 | -11.1 | 88.9 | 10.1 | 7.9 |
| 1992 | 64.8 | -27.1 | 75.1 | -16.4 | 27.0 |
| 1993 | 65.0 | 0.3 | 82.6 | 9.9 | 32.0 |
| 1994 | 47.0 | -27.7 | 62.5 | -24.3 | 6.2 |
| 1995 | 44.2 | -4.0 | 65.6 | 5.0 | 1.8 |
Source: Ministry of Economy and Reforms, Republic of Moldova

![]()